Developing a comprehensive directory of tools and technologies for social science research methods
This post originally appeared on FORRT’s Educators Corner
Often the search and exploration of tools and technologies in social science research is not part of the class curriculum in the same way as the systematic review of literature is. This, sadly, leaves the becoming researcher in a place of disadvantage, in my opinion. In their early research career, students will mostly rely on their supervisor or peers to advise on the tools they use, which is still a very limited sample. However, with strides in technological development, researchers could choose from a growing number of multivariate tools for social science methods rising from within the discipline itself, as well as borrowed from other disciplines or coming from the commercial sector.
Starting from this premise, we decided to build a tools directory for social scientists, a simple solution for a place where any researcher or student can come and find the right tool for what they need. In this piece, I explain how the tools directory was developed and how it can be used by educators, researchers and students.
Developing the tools directory
The initial list was based on software tools and tech platforms that we knew were popular among social science researchers because we’ve commissioned books about them, or they have been prominent within the community. We continued to ask academics, look through papers and other lists like the DiRT Directory from the Digital Humanities, the Digital Methods Initiative and SourceForge. Soon enough, the directory was growing out of control. What we thought would be a simple scroll down page, organised in a few basic categories, was not serving its purpose any longer.
With around three hundred different software packages and tools that we knew were used by some or many social science researchers in their work, a new challenge was becoming apparent. It was a paradox-of-choice situation. On one hand, it was increasingly clear why academics often rely solely on recommendations from their peers when choosing a tool. And on the other hand, we knew we needed to explore how one would choose the right tool from a list, and ultimately how to teach others to find the tool that fits their own purposes rather than simply recommending a tool they’ve used.
As the list grew, we enlisted the help of a few master students, and started collecting more data: who built these tools, were they free or paid, what cluster of similar tools would they belong to, when were they built, based on the information available could we tell whether they were up to date, scaling, or failed, could we find papers that cited these tools, were the creators recommending a citation etc.
When we hit 400 software packages/tools, we knew we had to promote this list and share it in a way that researchers would actually stumble upon it and have the opportunity to reference it in a lecture or paper. So we wrote a whitepaper summarizing the big trends on the development of tools and tech for social science research. We learned that both commercial and non-commercial tools are popular within the social sciences, but the ones that last longer and are more successful focus beyond the discipline and almost always have a person or teams of people dedicated to raising funds or expanding the community of users and contributors.
At 400 software packages/tools, we were still not sure the list was big enough. We then focused on specific methods and researched all the tools available to carry out that method or task within the research process. We looked at the evolution of technologies for that method in particular, as well as how it fits within the development of the method itself. We call these ‘deep dives’. We’ve done deep dives on tools for annotation, or tools for transcription, surveying tools, tools for studying social media data, and we kept finding more software applications within each of these areas. We concluded these deep dives to be quite useful, as they enabled sharing slightly more comprehensive sub-lists of tools that could be used in different modules. We have now 543 tools on the list, and the number keeps growing.
How to use the tools directory
The full directory is currently available on our GitHub repository as a csv file. We decided to host it on GitHub, in order to be able to update the directory when we come across new tools or after deep dives; ensure it’s always available for others to reuse in its most up-to-date form, and enable instructors, students and researchers to add tools that might be missing.
Educators teaching research methods or preparatory courses for students’ theses could present the full tools directory to students, so they are more flexible in finding the right tools for their needs and future projects.Students can browse through the list and filter for tools to find a tool that is most appropriate for a research project they are initiating. For example, a student transcribing interviews might look at the transcription tools to find alternatives. Similarly, educators that are teaching a more specialized course, such as introduction to text mining, data visualization, or social data mining, or running online experiments could filter out a sub-list of tools focusing on the explicit method. They could then share this sub-list as part of the course reference materials or assignments.

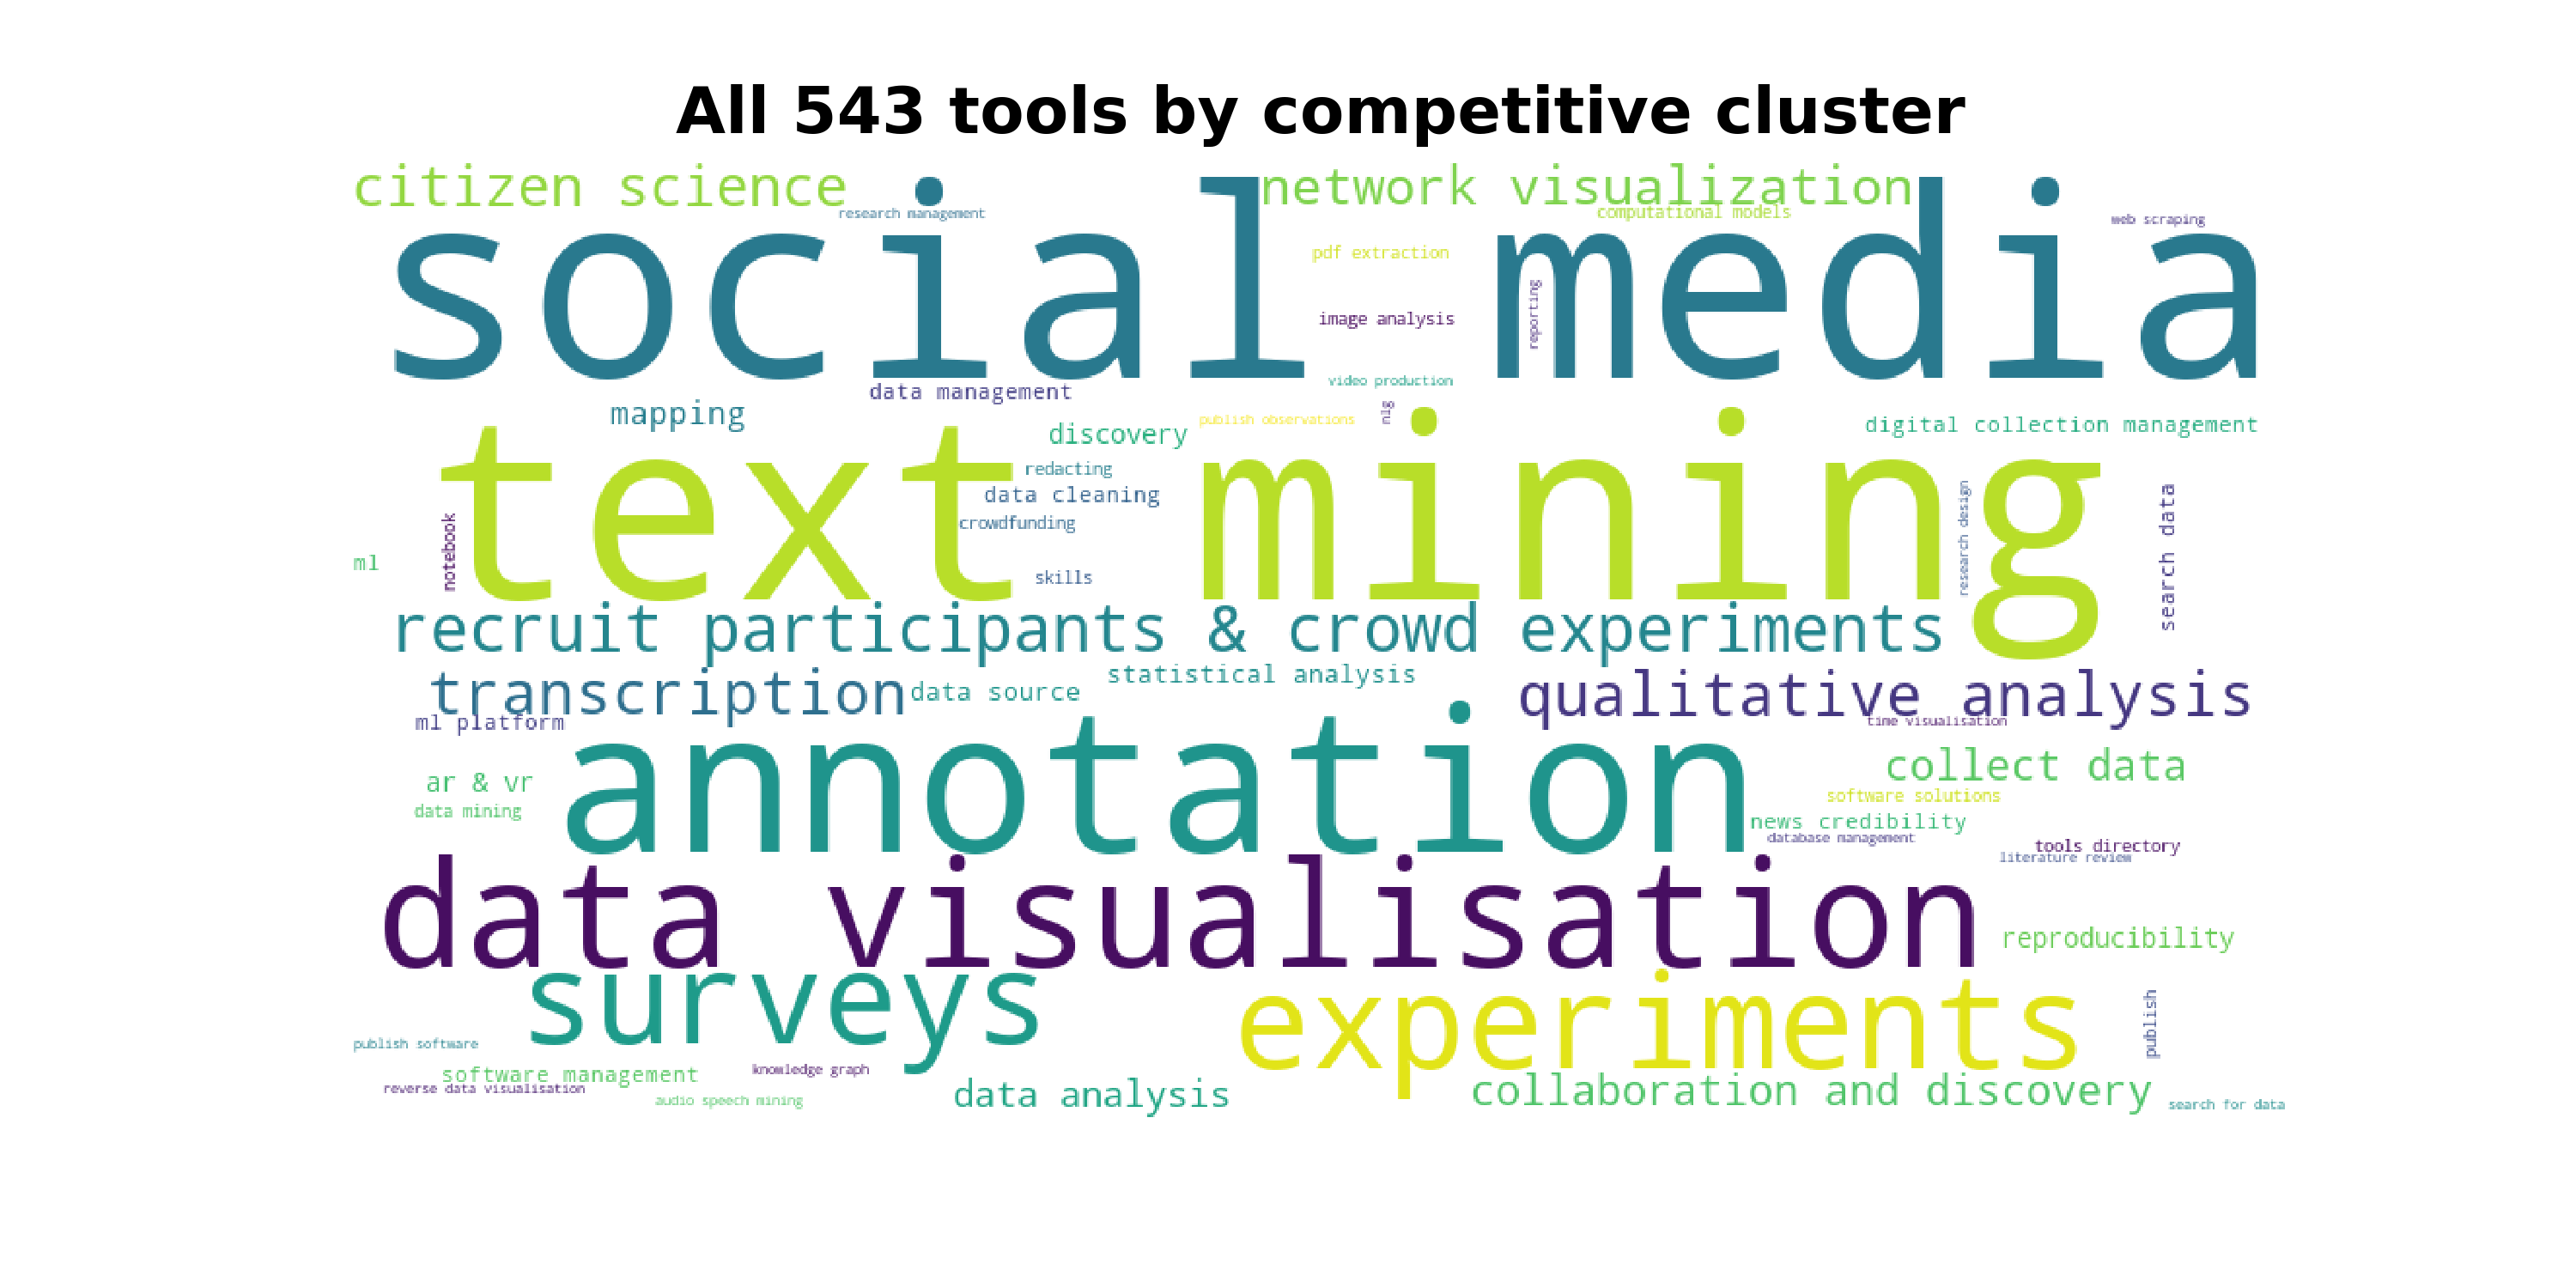
Fig. 1. The spread of 543 tools and technologies across methods and techniques.

Fig. 2. Filtering to find transcription tools. A student or instructor could filter by column F (the Competitive cluster which contains the method/technique/task/area that we used to categorize the tool) to get a sub-list of tools that could be broadly used for a particular process. If the cluster is too broad, the student can look through the technique (column E), that breaks it down further. For example for social media tools, the technique would include analysis, collection, visualisation etc. If looking for more recent tools, one can filter by the year the tool was launched (column M); or if the student is interested in something that is free, they can check the charges (column N).
While the csv file that contains the tools directory might be easy to update and share, we acknowledge that it might not be that easy to use within a classroom. We are experimenting with a variety of ways that would enable a better display and navigation of the directory, without losing from the ease of updating it.
In 2019 we did our first deep dive into the tools for social data science to support our SAGE Campus course on collecting social media data. We created a sublist to share for this course to help learners find the software that might be most appropriate for their own project, especially given the variety of social media platforms available. To render the sub-list in a more friendly way, we used the free version of airtable, which is a no-code app for relational databases with a colorful and modern interface. Students would navigate to this page (Fig 3) to see the sub-list on a single table. They can then find the right tool for their social media project by selecting the platform they want to collect their data from (twitter, instagram, facebook etc), whether they are happy to pay or looking for something that’s free, and the type of task they want to perform: whether they need the tool for collecting the data, analysis, or visualization. Once they have a filtered list, they can also look through the academic papers we’ve linked where each tool has been used, to explore further the potential of the tools.
, this interface lets the student filter the list down to narrow the choices for a tool they could use to either collect or analyse their data. This interface is web-based, and has a more inviting user experience than working with a csv file. A student can easily see the categories of tools, filter by multiple terms or concepts linked within each of the columns.")
Fig. 3. Screenshot of the sub-list containing social media tools via the free version of airtable. Similar to working with a csv file (as in Fig. 2), this interface lets the student filter the list down to narrow the choices for a tool they could use to either collect or analyse their data. This interface is web-based, and has a more inviting user experience than working with a csv file. A student can easily see the categories of tools, filter by multiple terms or concepts linked within each of the columns.
We envision this sub-list of social media tools to be a starting point, as it helps the learner filter down based on a limited number of criteria, such as: the task that can be achieved (collection, analysis), the social media platform that’s integrated, and the fees.
We’ve reused the same sub-list of social media tools with a different interface (pory.io, currently in beta) to render this list of tools more akin to a catalogue of records, that the student can search and filter. This rendering was used in a bootcamp on starting off with social media research. Similar to the airtable rendering, a student could filter based on the task they want to achieve and then click into the tool to get more information and explore which one would work better.
 rendered into a catalogue via the pory.io app. The user experience on this interface is friendlier than working with a table as in Fig. 2 & 3. A student can filter the list by the type of tool, which is immediately visible; for example they might be looking for tools to support their data collection. They can then use the search box to enter key terms and narrow down the list further, a process that is more familiar. The student can also browse the list of tools by opening the individual cards to find more information (see next figure).")
Fig. 4: Screenshot of the sub-list of social media tools rendered into a catalogue via the pory.io app. The user experience on this interface is friendlier than working with a table as in Fig. 2 & 3. A student can filter the list by the type of tool, which is immediately visible; for example they might be looking for tools to support their data collection. They can then use the search box to enter key terms and narrow down the list further, a process that is more familiar. The student can also browse the list of tools by opening the individual cards to find more information (see next figure).

Fig. 5: Once the student filters a list of tools, they can click one each card to get further information about each tool. Currently this includes a brief description, the platform supported, whether it’s free or not, and several academic papers that have used this tool.
Airtable and pory.io have different affordances for rendering the sub-lists of tools, and our experience so far is that both have been useful. We are hoping to learn more from these experiments, to understand the student’s journey as well as the data that would inform their exploration process.
The social media tools sub-list was part of a deep dive that we carried out in 2019. Since then, we dived into surveying tools and text mining. We have not created separate sub-lists for these, and encourage instructors to try other ways of representing these tools within their courses. If you are teaching text mining in the social sciences, for example, you can point your students to this overview of the text mining tools available (Fig. 6 & Fig. 7) and share a sub-list of the tools directory filtered for text mining with your students.

Fig. 6: Screenshot of the Text Mining section, an overview of tools available.

Fig. 7: Text mining tools and technologies based on the process they support.
Going forward
Going forward, we are quite interested in finding out what are the criteria people often use to filter down to their top tools, so we can build this list forward and continuously add the data that helps academics and students find the tools that fit their project best.
We understand that lists follow some form of a hype cycle, where there is a lot of work done at the start and some engagement from the community, and then the whole project slowly dies and it is forgotten. It becomes pretty unusable, because with the pace of research and technology, a lot of the tools are out of date and many new ones have popped up. A person must be dedicated to updating the list and for now we have that covered. Since the publication of the whitepaper in November 2019, we’ve added at least 100 more tools, mostly focusing on text and data mining. While it’s relatively easy to come across new tools, the hardest bit is updating the ones that are already on the list, and that’s where we are open for suggestions from the community. The list with updates to the whitepaper are available in this GitHub repository.
Finally, the locus of software tools and technologies within the research ecosystem remains a big challenge. Software tools are yet to gain the credit of research output. And that is why, among other reasons, software tools are rarely cited or referenced in papers. This is not only bad for reproducibility of research, but it also makes it difficult to help other researchers weigh in and compare different tools used for similar studies. We aim to promote and include the suggested citation of the tools in our list, and strongly encourage anyone to use https://citeas.org when unsure how to give credit to these.
We remain active and are continuously thinking of better ways to present and re-architecture the information about software tools and technologies we’ve gathered, to make it easier to navigate and explore. We hope these materials will help you and your students become more aware of the diversity of tools and technologies and will open new and potentially easier avenues to decide on the best software tool to use for your research.